This is Part 2 of a three-part series on THC potency inflation; see Part 1 for a discussion on how potency inflation in California is just as bad as ever. Just in case it is not clear that the following article is tongue-in-cheek, InfiniteCAL absolutely does not condone this behavior.
Are you a cannabis testing lab that is struggling to gain market share? Are you a lab that is losing clients due to low THC numbers on flower? Do you have clients out there promising you business if you would give higher THC numbers than their current lab? Well, don’t worry, we have you covered! We can show you data that anyone can use to bend any method, including the DCC standardized potency method, to your will! We’ll give you a few options, and you can mix and match to your liking:
Increasing the Sample Mass
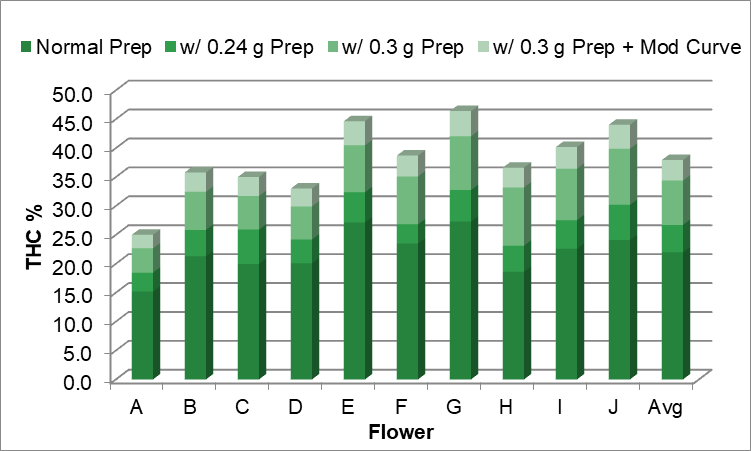
The more flower you weigh out, the more THC you can measure! The DCC standardized method specifies that 200 mg of flower must be weighed out for each sample preparation. Sure, you can record you weighed out 200 mg, but if you put in 240 mg or even 300 mg, you can increase your potency by 20-50%! It is as simple as changing the second digit to a 4 instead of a 0 or the first digit to a 2 instead of a 3. We put it to the test for you: we took the same flower, prepped it with the normal 0.2 grams, then prepped the same flower with 0.24 and 0.3 grams (while still representing and performing the calculations with a sample mass of 0.2 grams). Check out Figure 1:
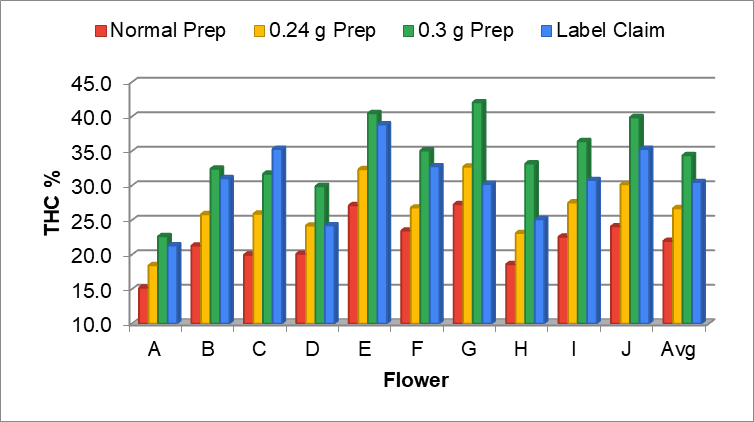
The average calculated potency went from around 22% with the normal 0.2 gram prep to over 34% with the 0.3 gram prep! That’s even higher than the average labeled value for these flower samples! With this method you can really dial in how much you want to increase the THC number for a client. Maybe some clients that you really want to land or keep get 0.250 gram prep, while the less important clients only get a 0.220 gram prep. The options are endless, and you can make sure you never lose a client again!
Diluting the Sample Solution Less
What you’re really looking for is a more concentrated solution of THC, so if you don’t want to add more flower, just add less solvent! After weighing out your sample, the DCC standardized method requires an extraction step using 40 mL of solvent (80:20 acetonitrile:methanol). Just use 30 mL instead, and say you used 40 mL, who knows what your solvent pump is set to as long as when the DCC is doing an inspection you set it to the right volume! This can increase your potency by more than 33%! We also ran these 30 mL extractions alongside their normal 40 mL preps on some other flower samples to demonstrate the difference; see results in Figure 2:
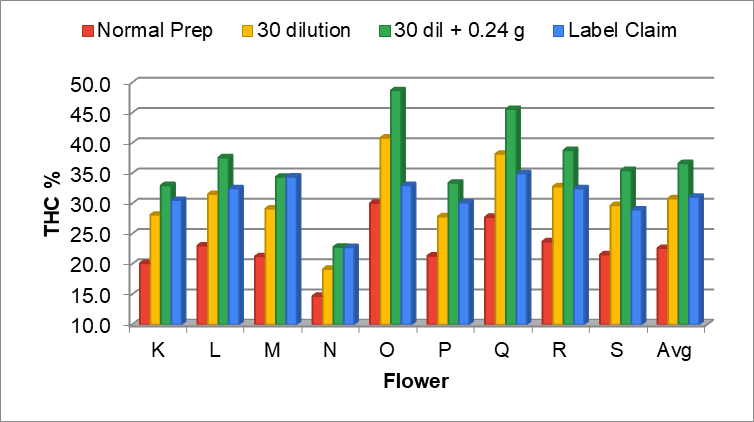
With the 30 dilution modification, the average calculated potency on these samples went from 23% to 31%, exactly in line with the average label claims! To take it a step further, we stacked prep modifications: for these samples, we also tried a 0.24 gram sample mass with 30 mL extraction, and got average THC concentrations north of 36%. For Sample M, that prep combo matched the label claim perfectly, looks like we might have cracked the code on how this lab “made it work” for their client!
Modifying the calibration curve
You don’t even have to deviate your sample prep from the normal method if you can modify the calibration curve! If we are trying to inflate potency results, this can be done in a few different ways: For your calibration standards, you need to use a certified reference material, but you want to make it lower in concentration than what it says it is. Lower concentrations for calibration make your samples seem higher in comparison. It’s so simple anyone can do it: all you have to do is degrade the standard after you get it or add some more solvent to it when you transfer from the ampule to the storage vial or while you are preparing the curve points. Whichever way you do it, you can boost your numbers! To demonstrate, we took the data from all 34 normal flower preps we performed, and reproduced a 5% and 10% pipetting error on each serial dilution. See Figure 3:
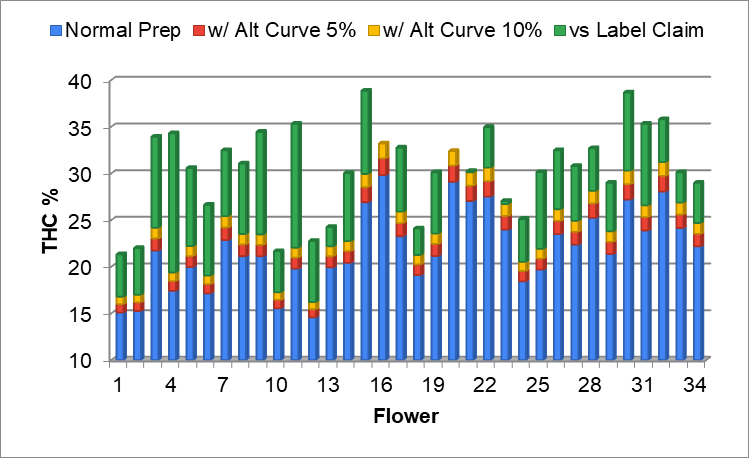
Now, for these 34 results, you can see that even the 10% curve modification only brought us up to the label claim for around 5 of the samples, so you might have to get really aggressive with this modification to keep up with the other labs! This is just one tool in your tool belt so don’t forget, for best results, make sure to use all your tools when attacking the problem. That brings us to our last point: stacking the mods!
Multiple Modifications at Once
You can achieve much more dramatic increases in potency if you use multiple modifications at once! Figure 4 shows the effect of each individual modification on the potency of the sample:
You can see how the individual effects of these mods can really stack up; for instance, Sample H increased its potency from 17% with a normal prep to 36% with a 0.3 gram prep plus a 10% modified curve! Maybe you don’t want that dramatic of a change, but you can see a few mods will take you a long way towards achieving the potency you desire!
(Ok, ending the farce here)
So the point of this article was to be a provocative insight into certain decisions that labs make, and to illustrate just how easy it is to manipulate any method. This is actual data with actual samples that are on the shelf right now, prepped and analyzed using the DCC standardized method, then prepared following the modifications above. The modifications we made (purposely changing the sample mass, modifying the dilution, bringing the curve down) are clear examples of fraud and may not stand up to extreme scrutiny, but can all be hidden if you have someone that is willing to record a piece of data that is different from what is the truth.
Going through this process, it was striking to see how dramatically we had to change things to get into the realm of where the label claims were for some of these samples. What this means is, any lab is inflating potency to this degree either has someone in charge that is really good at hiding these modifications from their employees, or it’s an open secret within the lab that they are doing a procedural step differently than they should be.
We are calling this lab fraud. It is not a term we use lightly. We bend over backwards to try to figure out whether we are doing something wrong, or if there are other explanations for why the results from flower we test off the shelves are so different from what they are labeled to be. But the market pressure is so clear, the trends are unarguable, and we aren’t the only ones yelling about this. Even without these arguments though, we have some pretty good data to refute some claims you will hear from other labs as to why the results differ so much:
How homogeneous is the flower? Does it degrade on the shelf?
Two excuses you hear often from labs are “our results reflect the sample I was allowed to collect from the representative batch; whatever sample you pulled off the shelf may have just been naturally lower than our sample” or “after the producer packages it and lets it sit on the shelf, it degrades over time and should have lower Total THC off the shelf than at the time of testing.” To test these theories, ICAL went and purchased 5 different packages of a flower sample we had performed the original compliance testing for. Five different 1/8th oz packages were collected from the shelves from local stores that were all the same METRC ID and batch number. We had initially performed the compliance test on the bulk flower, so after our test, these samples were processed to be bagged, then transported to shelves, where they sat for 3 months. Each 1/8th oz was treated as its own sample and was homogenized, prepared, and analyzed in triplicate. The average results from the triplicate preps are summarized in Table 1:
| Package | Label Claim % | Average THC % | % Difference |
| 1 | 22.84 | 23.05 | 0.93 |
| 2 | 22.84 | 22.85 | 0.06 |
| 3 | 22.84 | 22.35 | -2.15 |
| 4 | 22.84 | 24.45 | 7.05 |
| 5 | 22.84 | 22.90 | 0.28 |
| Average: | 22.84 | 23.12 | 1.23 |
There were samples that had results both above and below the label claim, with a range of -2.15 to +7.05% (22.35%-24.45%) against the original result of 23.12%. While there is some small variation from package to package, it is not anywhere near the 30% or more relative differences we’re seeing in these shelf studies. And there certainly isn’t a bias towards a lower total THC value despite these samples being on the shelf for three months. This is pretty compelling evidence to discredit the claim that cannabis has a large loss of THC when packaged and shelved.
Statistical Anomalies
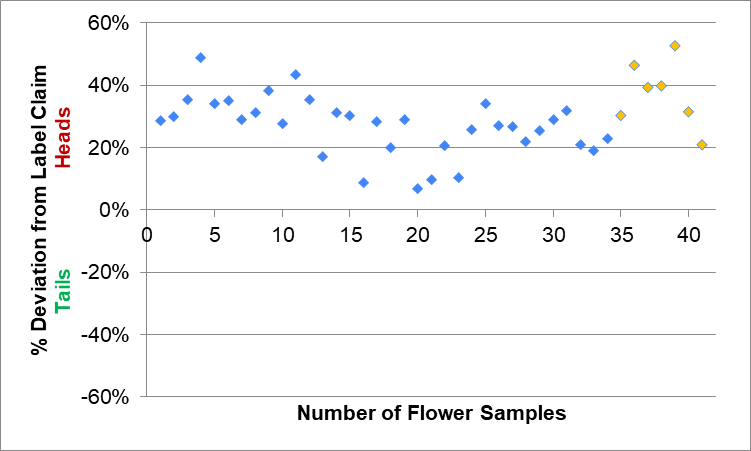
When looking at the labeled values compared to the DCC method being run as prescribed and assuming no funny business, we would expect to see some packages be above the labeled value and some below. All batches undergoing a randomized sampling protocol by a certified lab should provide an average Total THC value for the whole batch. This means that if you broke up the batch into ⅛ oz containers, some would have THC amounts above the labeled and some below (typically +/- 10% relative, i.e. 20-22%). When we look at this data set of 41 samples of flower and prerolls tested after 1/1/2024, all the samples were above the label claim!! To consider how unrandom this result is, it is like flipping a coin and expecting heads 41 times in a row. To put that into perspective, you have about a one out of 2,200,000,000,000 (2.2 trillion) chance of flipping a coin 41 times heads in a row, as compared to about a one out of 300,000,000 (300 million) chance of winning the Powerball or Mega Millions.
This study was focused upon demonstrating the pitfalls of relying on a standardized method, such as the DCC standardized method, to stop the ever-increasing creep of THC numbers upwards. We do not wish to demonize standardized methods as a whole. Standardized methods have their place, and can be used as a guidepost for new labs and for regulators. But they are not themselves the solution to fixing potency inflation. As with any rule, regulations are useless without enforcement.
We know the ways labs can cheat; these routes above are just a few; we didn’t even cover homogenization, sampling, or moisture content. No matter how you do it, if you do cheat, you have to know that the number isn’t real. And any sort of proper surveillance testing will prove it.
Anyone that has been in this industry for a long time has been forced to play this game to get onto the shelf, and there are a lot of directions we can point our fingers. But at some point we need to stop blaming growers, buyers, distributors, budtenders, etc, and start coming together to end potency inflation. Stay tuned for the final part of the series, where we will discuss possible solutions.
About the Authors

Josh Swider is the founder and CEO at Infinite Chemical Analysis Labs his passion for analytical chemistry and consumer safety he has made his mission ensure only safe; quality cannabis products are allowed to be sold to consumers.

Erik Paulson is the Lab Director for Infinite Chemical Analysis Labs in San Diego, California. As a former high school educator turned analytical chemist, he has a passion for educating both cannabis industry professionals and consumers on the ethical challenges the cannabis industry faces.